
All of these things started when we finally get the information from our friends from Japan, called Kentaro-san.
He introduces us the app called DiFluid, then we started to explore them about how we are adjusting the independent variable (lately we already post about this but confused about in- and dependent categorization) for pour-over method. Like this:
- Coffee-2-Water ratio
- Water Concentrate (ppm)
- Water Temperature (Celsius degree)
- Dose
- Ground Size
- Pulse (how many with blooming phase)
- Pouring Method (Circle, center, zigzag, etc.)
- Coffee bed area (dripper type: conical or flat bottom)
- Paper filter
- Dripper Material
So, there are so many variables we can explore to get the better result (can be known by the Average extraction yields (AEY) and Total Dissolved Solids (TDS)).
AEY below 18% were considered under-extracted and were associated with less-enjoyable flavors like grass and peanuts. Conversely, extraction yields above 22% were associated with bitterness and astringency (Gagne, 2020).
The Coffee Brewing Institute identified an acceptable TDS range between 1.0% and 1.5%. These preferences are essentially independent of those related to average extraction yields. They simply reflect our personal preference for the strength of our coffee (Gagne, 2020).
For now, we already know what a “good” coffee is, looking for the ideal range of brewed coffee based on TDS and Avg. EY.
After collecting 36 filtered coffee brew record, finally we can create the function of Input Water and Yield as can be seen below:
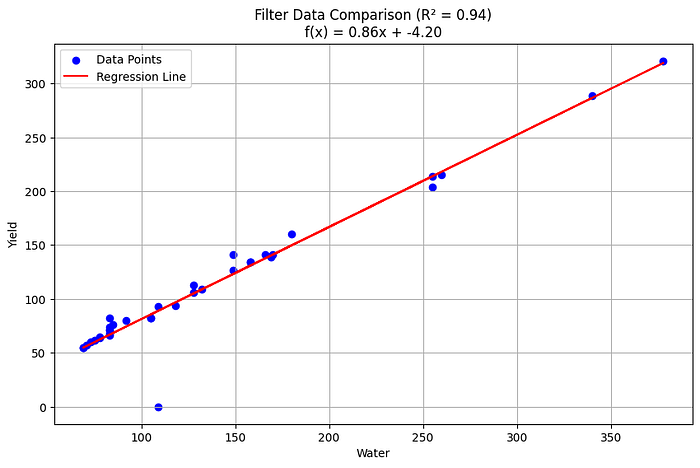 Yield to Water Input Function
From the function we got the R-square is about 94%, so the accuracy between actual and predicted is looks similar.
Going back to the brewing chart, actually we’ve already created version that using input water to coffee ground ratio instead of using grams per liter ratio (SCA version).
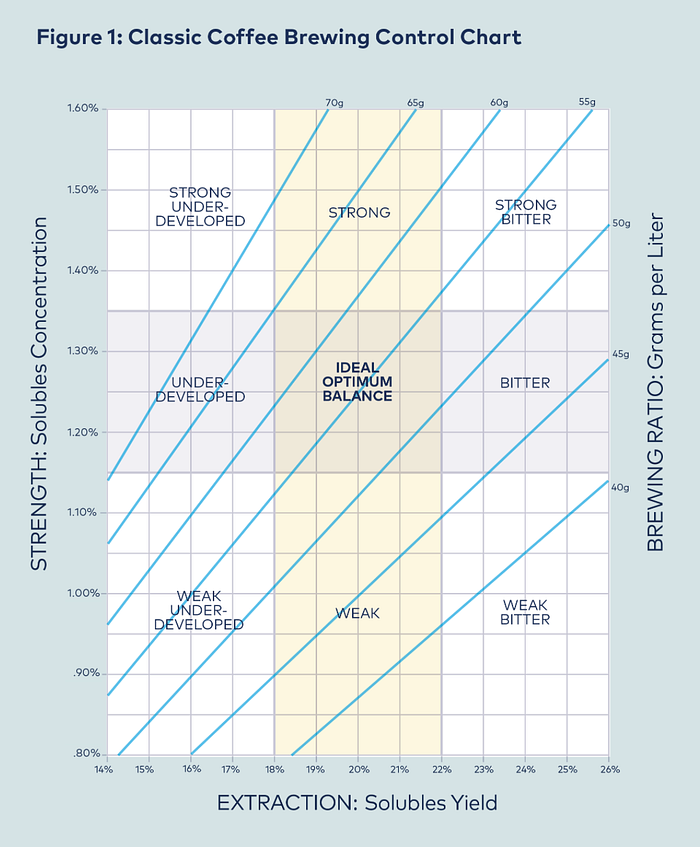 Brewing Chart using Grams per Liter ratio (SCA)
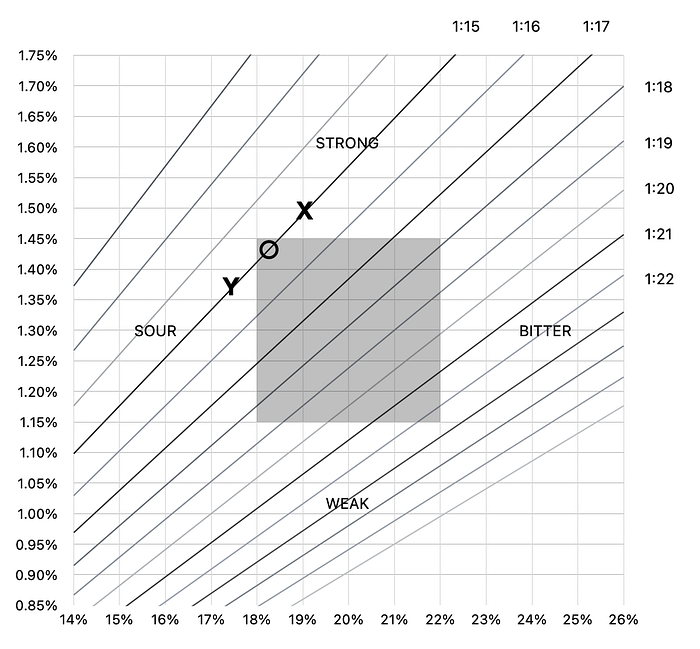 Brewing Chart using Input Water per Ground Coffee for ratio
Now, you can expect your brew result based on the ratio used, for example if using 1:15 ratio, you can get the ideal range only and only if you can get the TDS is around 1.43%, higher than that (X) going to be stronger and less will resulting more sour (Y).
But all of this tools can be developed through other inventions in the future, and ideal range from SCA is not always be the best for everyone, so this chart is actually can be used to adjust your brew, if the first brew is too weak, u can reduce the ratio, or if going to the other one, you can increase your ratio to weaken the brew result.
The next article we’ll try to discuss about the “New” Brewing Chart that including tasting notes on it.